
Tips for Excel, Word, PowerPoint and Other Applications
Stacking Data for Better Analysis
Why It Matters To You
Garbage in, garbage out. If your underlying data structure sucks, your analysis is going to suck.
Stacking, and I mean data stacking, not clan stacking (sorry ... inside joke) is probably one of the top 6 things I'd encourage everyone to learn about Excel. Conceptually, it's simple ... organize your data, but once you dig into how Excel works, you'll understand that it's all really about organizing your data so that the functions work in the best way possible. Failure to account for this foundation step means the difference between a 15-second pivot table and not being able to do one at all. It means the difference between manually crawling through 16000 lines of data to identify unique vendors or being able to autofilter the data set and see all them. Put into brutally honest terms, it's the difference between staying late Friday afternoon and leaving for the weekend early.
How To ...
Before you ever start your writing your first formula, you should always take a step back and understand what you're actually looking at and how it's organized. Often times reports are formatted so that they're easy to read, which is not the same as being easy to analyze. All too often, I see people dive right into a data set, churn about for a while, then realize they can't extract the information they want. Five minutes up front, assessing the data, could have saved them an afternoon.
Prior to performing analysis, data should be formatted such that each row represents a complete observation (stacking). It may be necessary to eliminate headers, footers, extra line breaks, add columns, add titles and source notes, or modify variable names.
The following examples can also be found in the sample file, stacking.xls
Errr ... What Exactly Do You Mean?
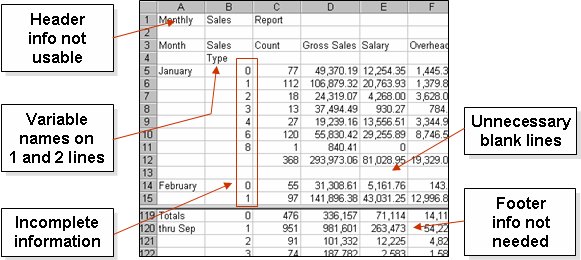
Here's an example of a data set that was output from a reporting system. What would happen if we tried to run a pivot table on this? Some data might get double counted (sales type), we can't report by month, and the blank cells would generate some unneeded noise. The notes show some of the elements we want to clean up.
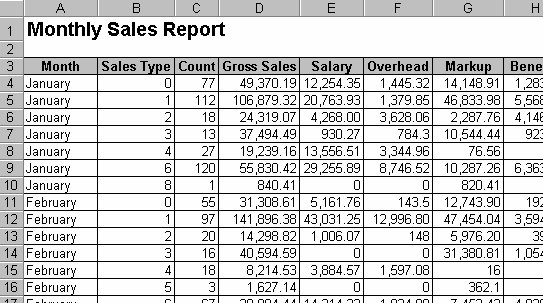
Now here is the same file, just cleaned up and stacked. It may be harder to read, but this will be a dream to run through a pivot table.
The Good
Some data files are easy to stack. This example is already nicely organized, with complete information, and no line breaks. It probably just needs a more descriptive title and some notes indicating where the data came from.
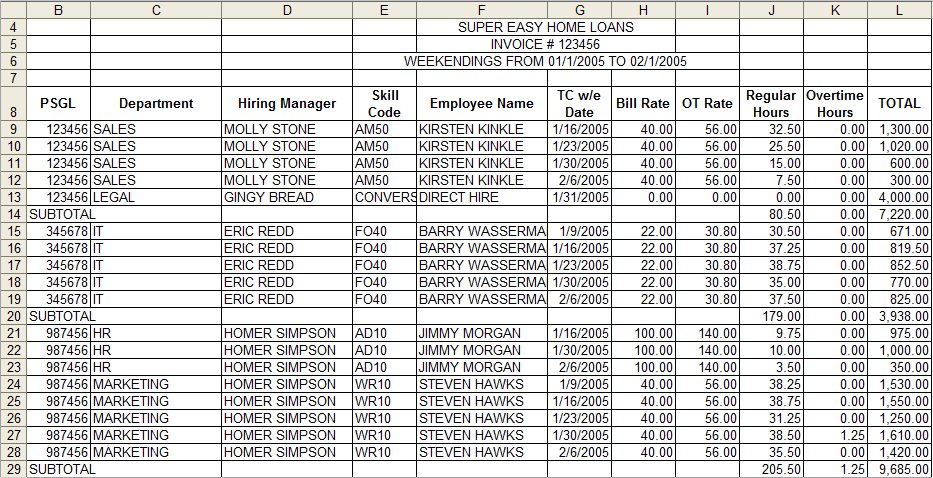
The Mostly OK
Look for patterns in the data layout to find quick ways to reorganize your data in a more usable format. Here, is a contiguous data set, except for the subtotals. Simply sort by PSGL, delete the subtotals, which will be nicely grouped, and youre ready to go. This works well because all the PSGL values are numerical which will sort before the SUBTOTAL and TOTAL lines, which means that all the rows you want to delete will be grouped together nicely at the end of the data set.
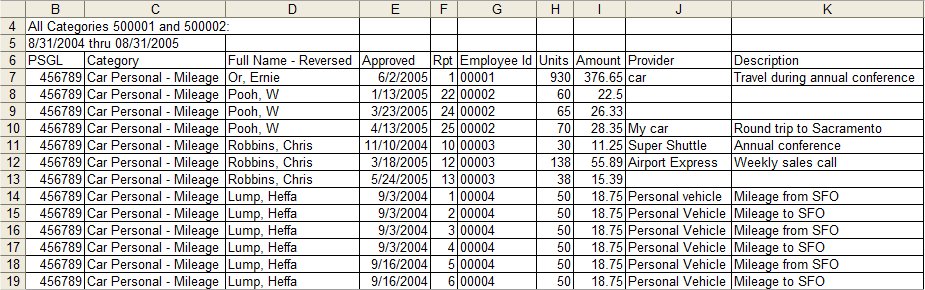
The Ugly
Heres an ugly example, where two types of data (vendor name and address) are combined within the same column. At 16K lines of data, it could take hours to manually associate the vendor name with each transaction to create the nice stacked data set we want ...
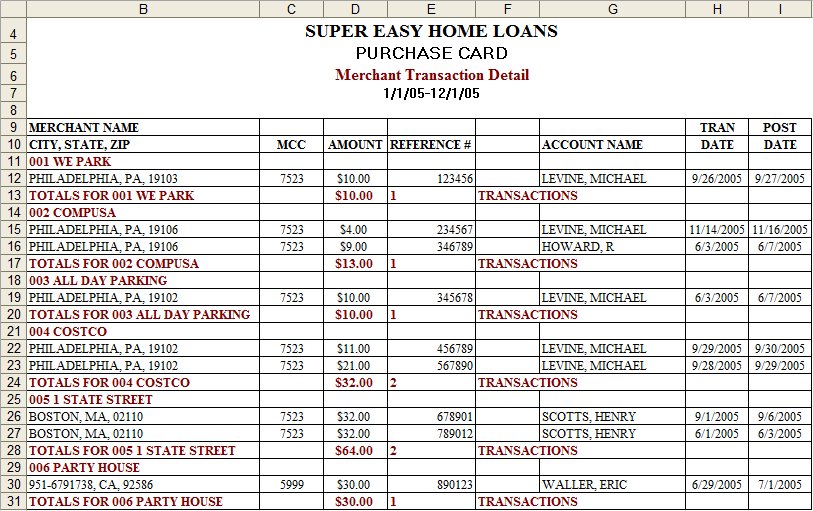
However, if we take some time to understand how the data is laid out we can reduce hours of work into about 5 minutes of effort, by adding a column (Vendor) and writing a simple formula to either pick the vendor name or use the name in the preceding cell. Remember, while you might not see any logical rules in the layout, these reports are all output by machines who are given rules about how to organize and present the information. You just have to reverse engineer the process.
So, what logical rules do you see in the data set above that we could use to separate our vendor names?
Observations about the Data Set
- Every transaction is associated with an MCC code.
- We only want to keep the rows with transaction data.
- The MCC code of the first transaction of every new supplier listing is always preceded by two blank cells above it.
- The vendor name is always in the same relative position to the MCC code of the first transaction (e.g, one row up and one column to the left).
- In all other cases, we can use the vendor name in the preceding cell.
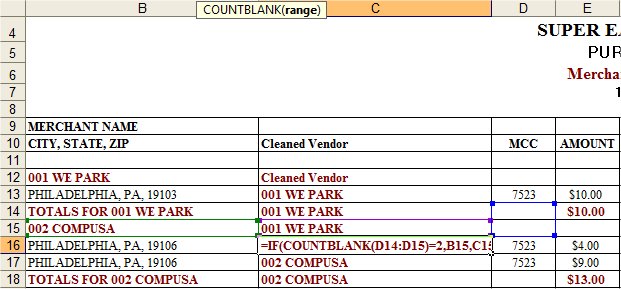
These observations allow me to create a formula that looks like:
=IF(COUNTBLANK(D14:D15)=2,B15,C15)to map vendor names. This basically tests each cells in the MCC column to see if there are two blank cells above it. If so, return the vendor name (one row up and one column to the left) otherwise just return whatever is directly above it. Once my formula is written and copied to the bottom of the data set, I copy and paste as values, conduct a quick sort on the MCC column and delete all of the rows with blank, which allows me to eliminate all non-transaction data. Done! NOTE: I have to freeze the values of my cells (Copy, Paste as Values) otherwise they'll recalculate once I execute the sort.
Summary
Remember stacking data means that one rows is equal to one record. The advantages of stacking data are ...
- Facilitates easier navigation in the data set
- Allows easier calculations across the data
- Supports pivot table analysis
- Supports more effective AutoFiltering
- Supports array calculations
- Facilitates naming ranges for faster access to data
REMEMBER!
- Look for the patterns in the way your data is arranged
- Make a back up copy before radically changing a data set
Notes
| Last updated | 9/5/07 |
| Application Version | Excel 2003 |
| Author | Michael Kan |
| Pre-requisites | None |
| Related Tips | Introduction to Pivot Tables in Excel |